Map position synced with charts
The 3D map follows the same cursor as the telemetry charts. When you inspect a speed drop, delta loss, brake spike, or steering correction, the map shows the corresponding position on the circuit.
3D track maps
Charts explain what the car and driver did. A track map explains where it happened. Hotlap.ai combines 3D circuit maps with synchronized telemetry so brake release, throttle pickup, steering, speed, and AI findings are tied to the exact part of the lap.
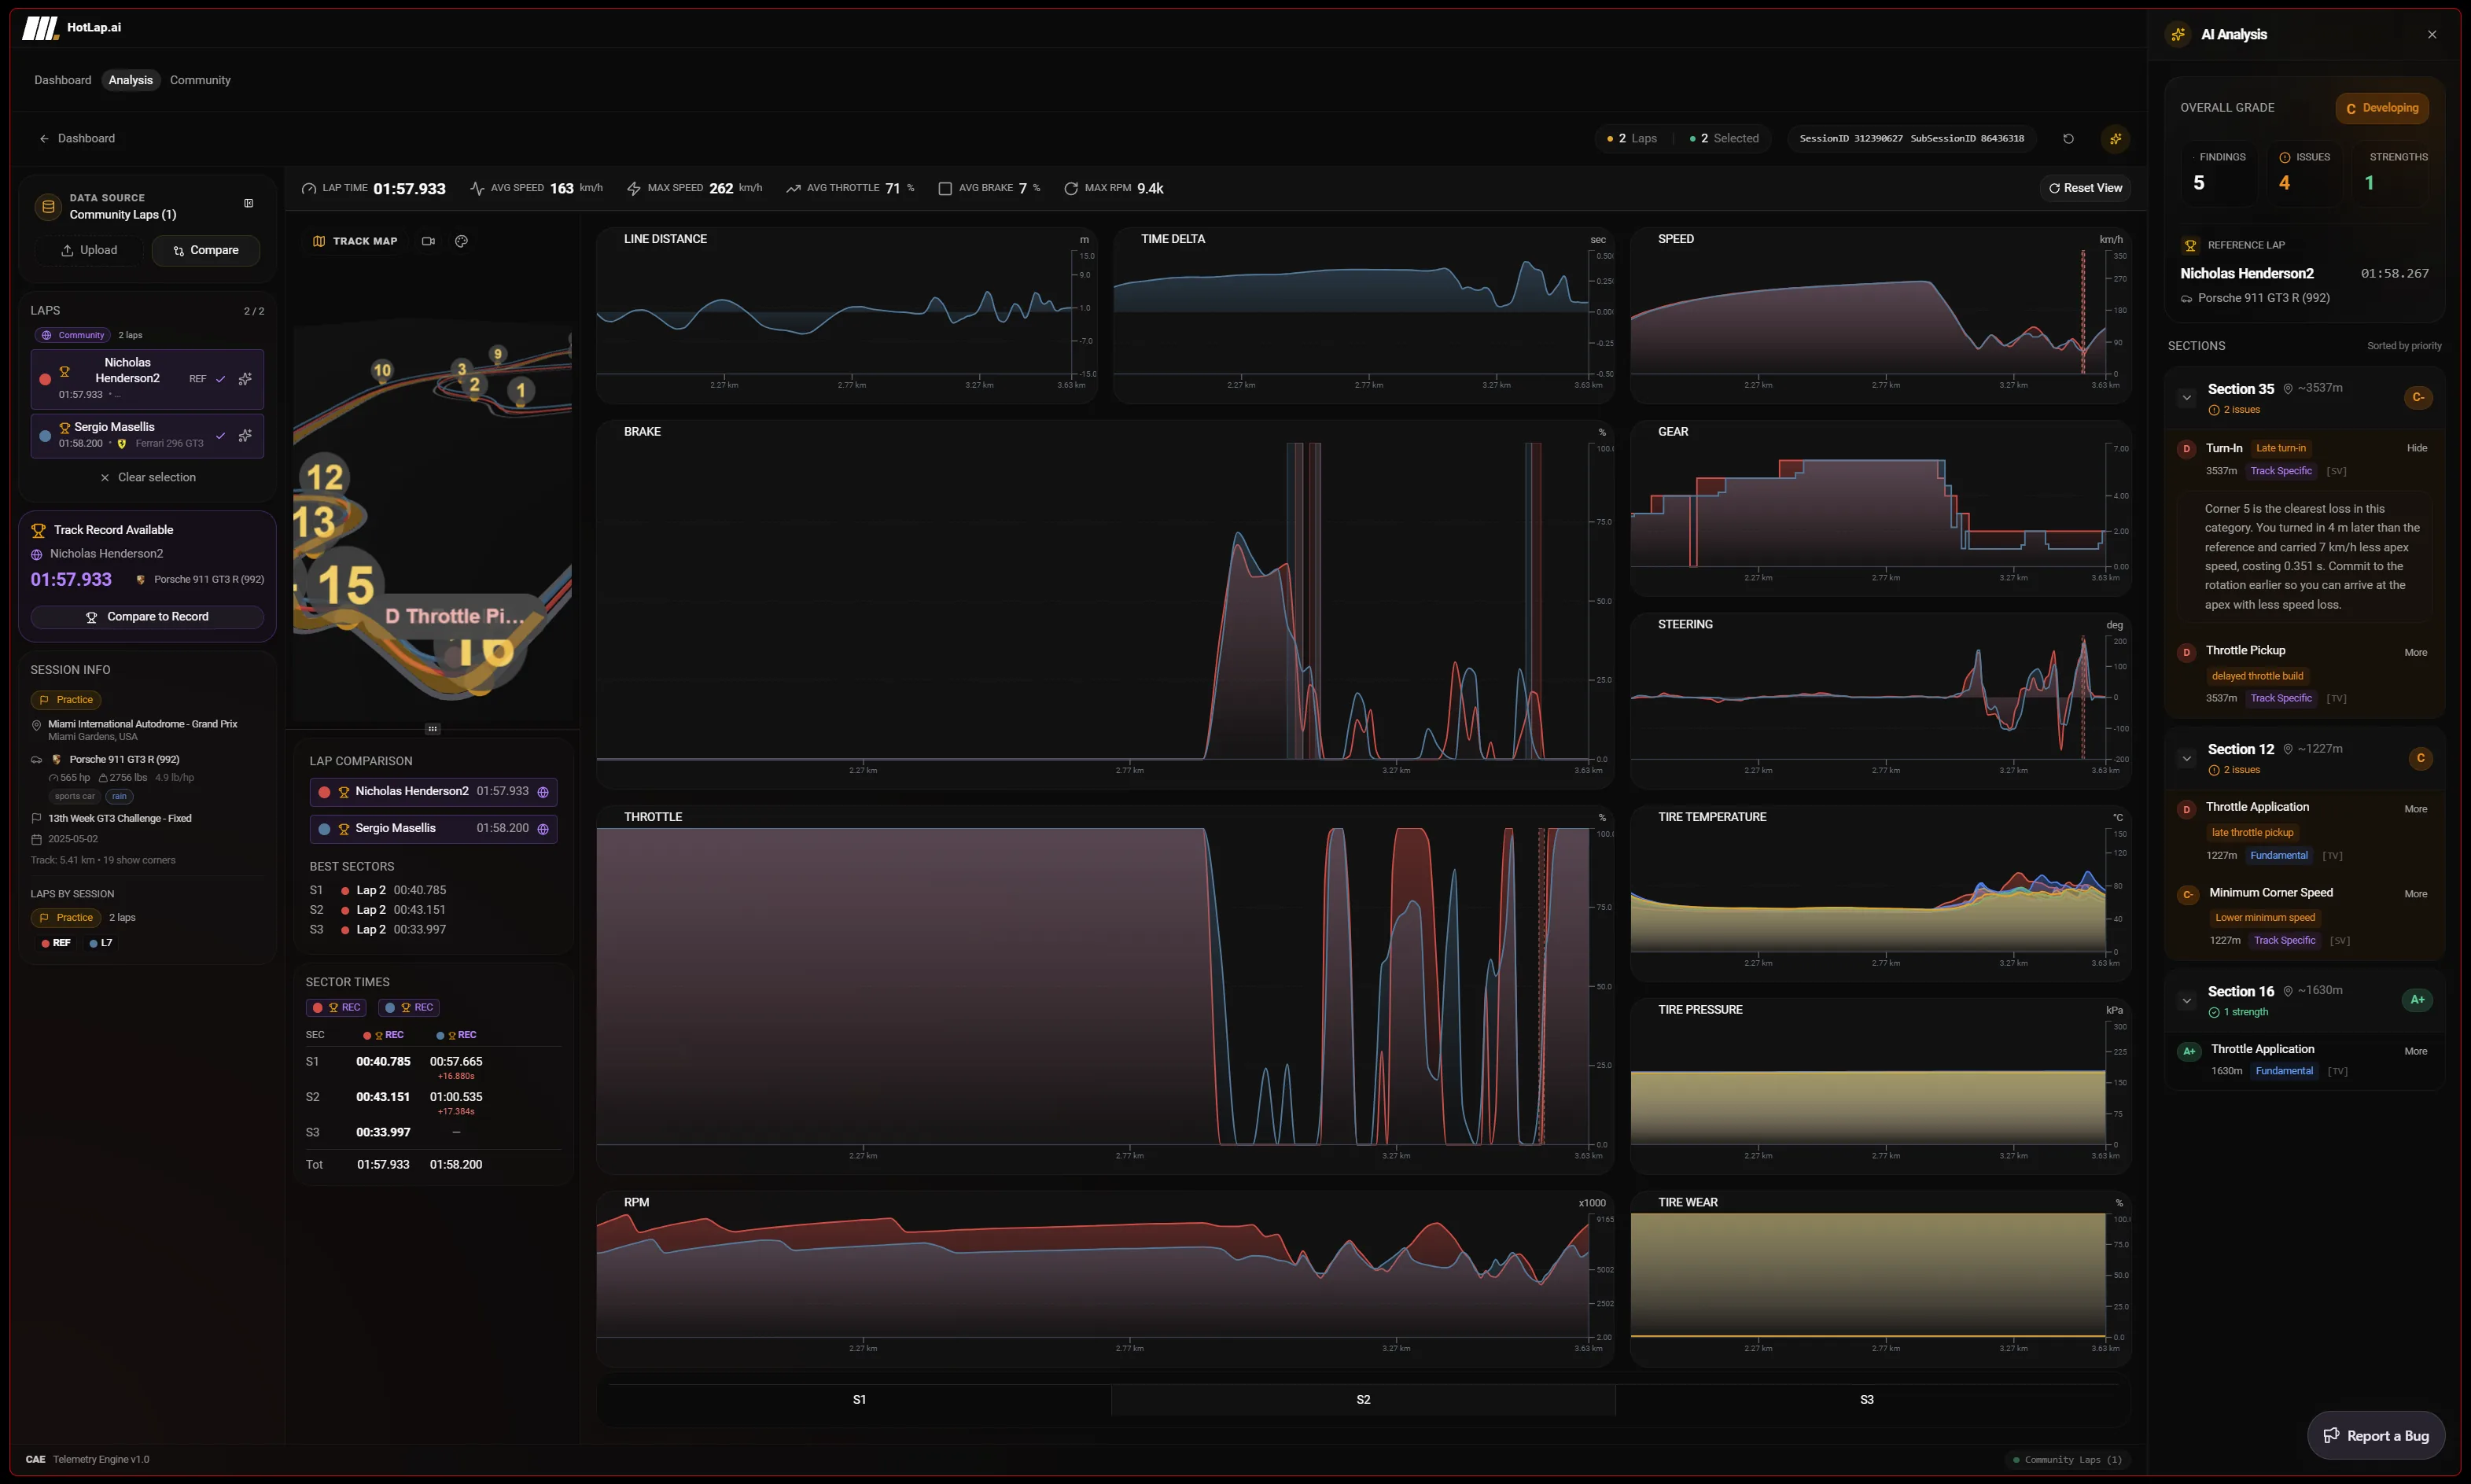
The 3D map follows the same cursor as the telemetry charts. When you inspect a speed drop, delta loss, brake spike, or steering correction, the map shows the corresponding position on the circuit.
Telemetry coloring helps make fast and slow sections easier to scan. Sector markers, corner context, and AI finding markers help drivers connect a chart issue to a physical braking zone, apex, or exit.
Many sim racers learn faster when a trace is connected to a corner shape. The map view makes it easier to understand line, minimum speed, rotation, and exit speed without relying only on stacked charts.
A focused path from session data to the next change you can test on track.
Start from the 3D map when a chart alone does not make the problem obvious. The cursor links the trace to a physical point on the circuit.
Use the map to understand whether the issue happened before turn-in, during rotation, near apex, or on corner exit.
Sector, corner, and AI finding markers help you avoid guessing which part of the track a chart spike represents.
Once the map shows where the issue happened, confirm it with speed, brake, throttle, steering, gear, and delta traces.
This page is about spatial understanding. It should help drivers who know there is a loss but need to see where it happens on the circuit and which phase of the corner caused it.
The map is especially useful for line, rotation, apex, and exit-speed issues because those problems are easier to understand when the track shape is visible.
A 3D track map makes it easier to connect a data problem to a driving problem. Instead of only seeing a delta change, you can see whether it happened at braking, rotation, apex, or exit.
Yes. AI finding markers can be shown with the map and chart context so drivers can jump from a coaching point to the relevant part of the lap.
Use Hotlap.ai to compare the lap, understand the inputs, and leave review with one clear thing to try next.