Distance-aligned overlays
Lap time comparison only works when the traces line up. Hotlap.ai aligns laps so differences are shown at the same part of the circuit, even when laps come from different sessions.
Lap comparison
Hotlap.ai makes lap comparison fast enough to use between sessions. Pick two laps, align them by distance, and inspect exactly how each input changes through every braking zone, apex, and exit.
Lap time comparison only works when the traces line up. Hotlap.ai aligns laps so differences are shown at the same part of the circuit, even when laps come from different sessions.
The 3D track map shows where the driver is on the circuit while charts reveal what the car and driver are doing. Telemetry coloring, cursor sync, camera modes, sector markers, and AI markers help connect a time loss to a specific corner phase.
Beyond one fastest lap, Hotlap.ai helps drivers understand repeatability. Sector and consistency views make it easier to identify whether the pace is available once or repeatable across a stint.
A focused path from session data to the next change you can test on track.
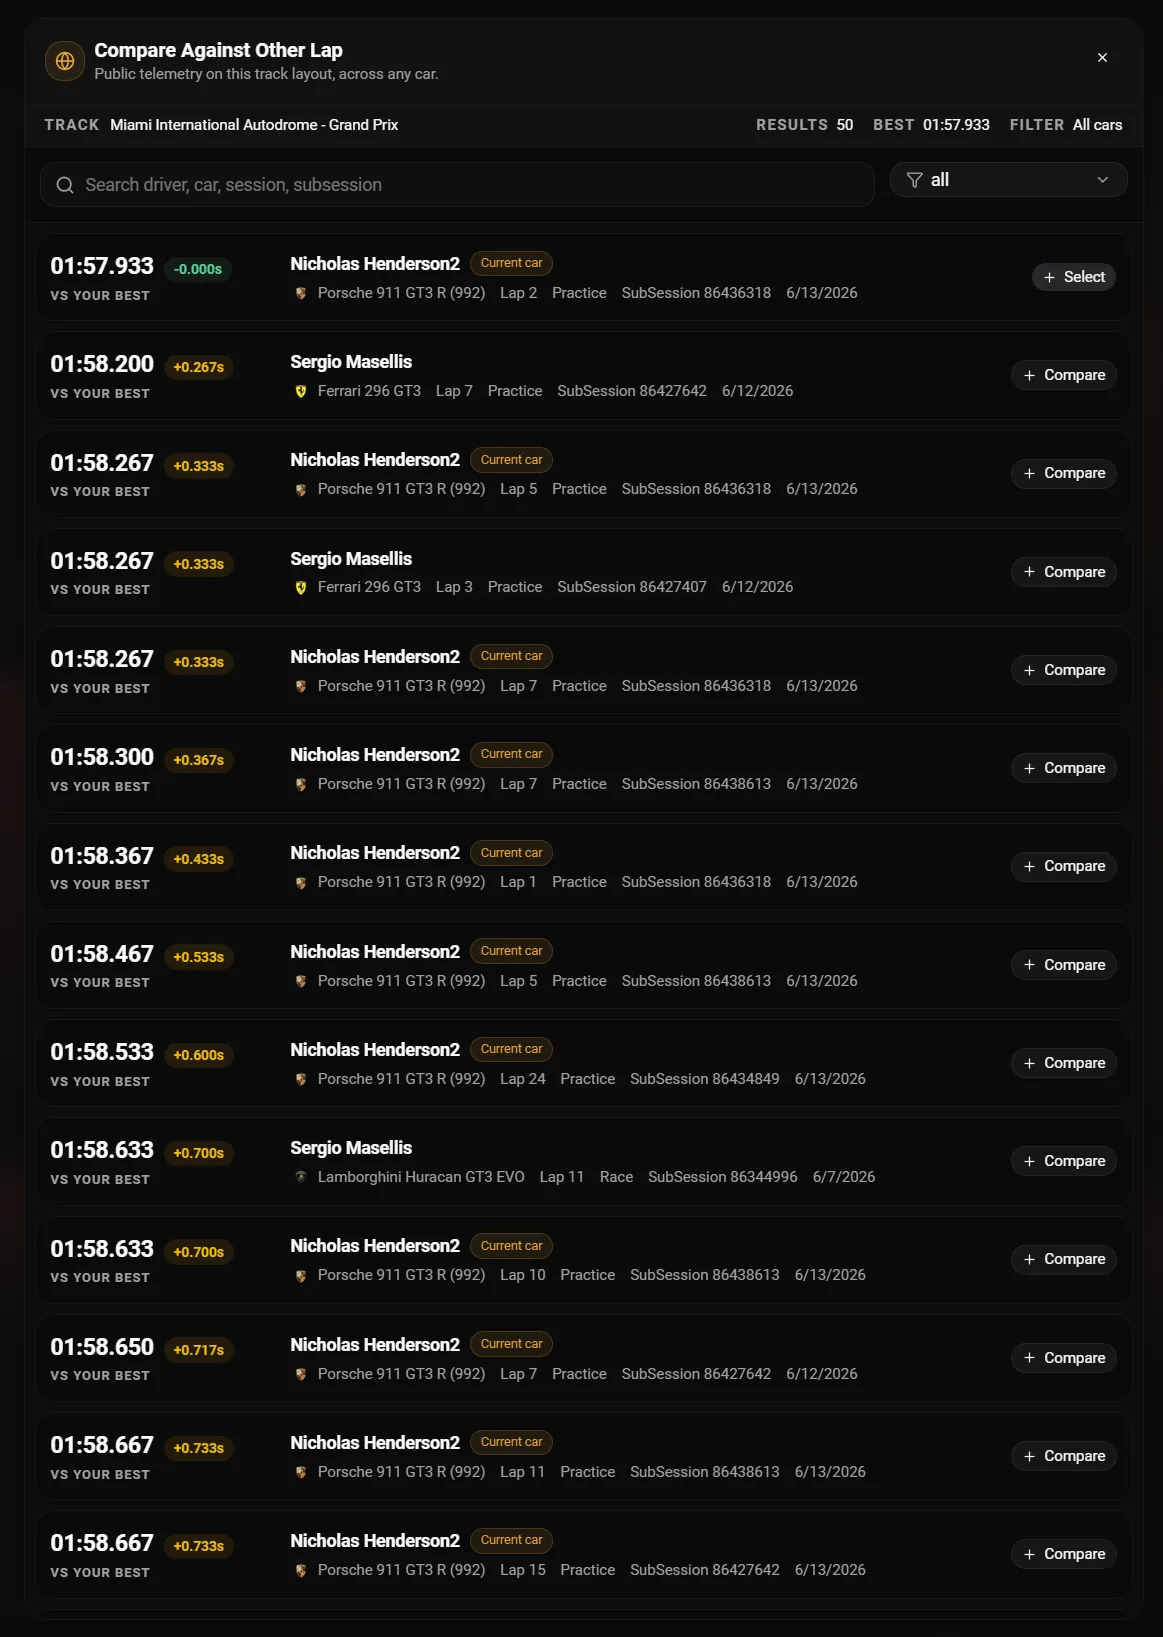
Choose your lap and a target lap from a personal best, teammate, live lap, or community reference. The comparison starts with the question: what did the faster lap do differently?
Hotlap.ai aligns traces by track distance, so the brake zone, apex, and exit line up even when the laps are different speeds.
A delta change becomes useful when it is viewed beside speed, brake, throttle, steering, gear, RPM, tire data, and 3D map position.
Use sectors and lap stats to see whether the faster approach is repeatable across a stint or just one peak lap.
This page is about comparison, not general analysis. It should answer a specific question: what did the faster lap do at the same point on the circuit?
Start with the compare picker, choose a relevant reference, then look for the first distance where the delta changes. That keeps the review tied to a real alternative line or input pattern.
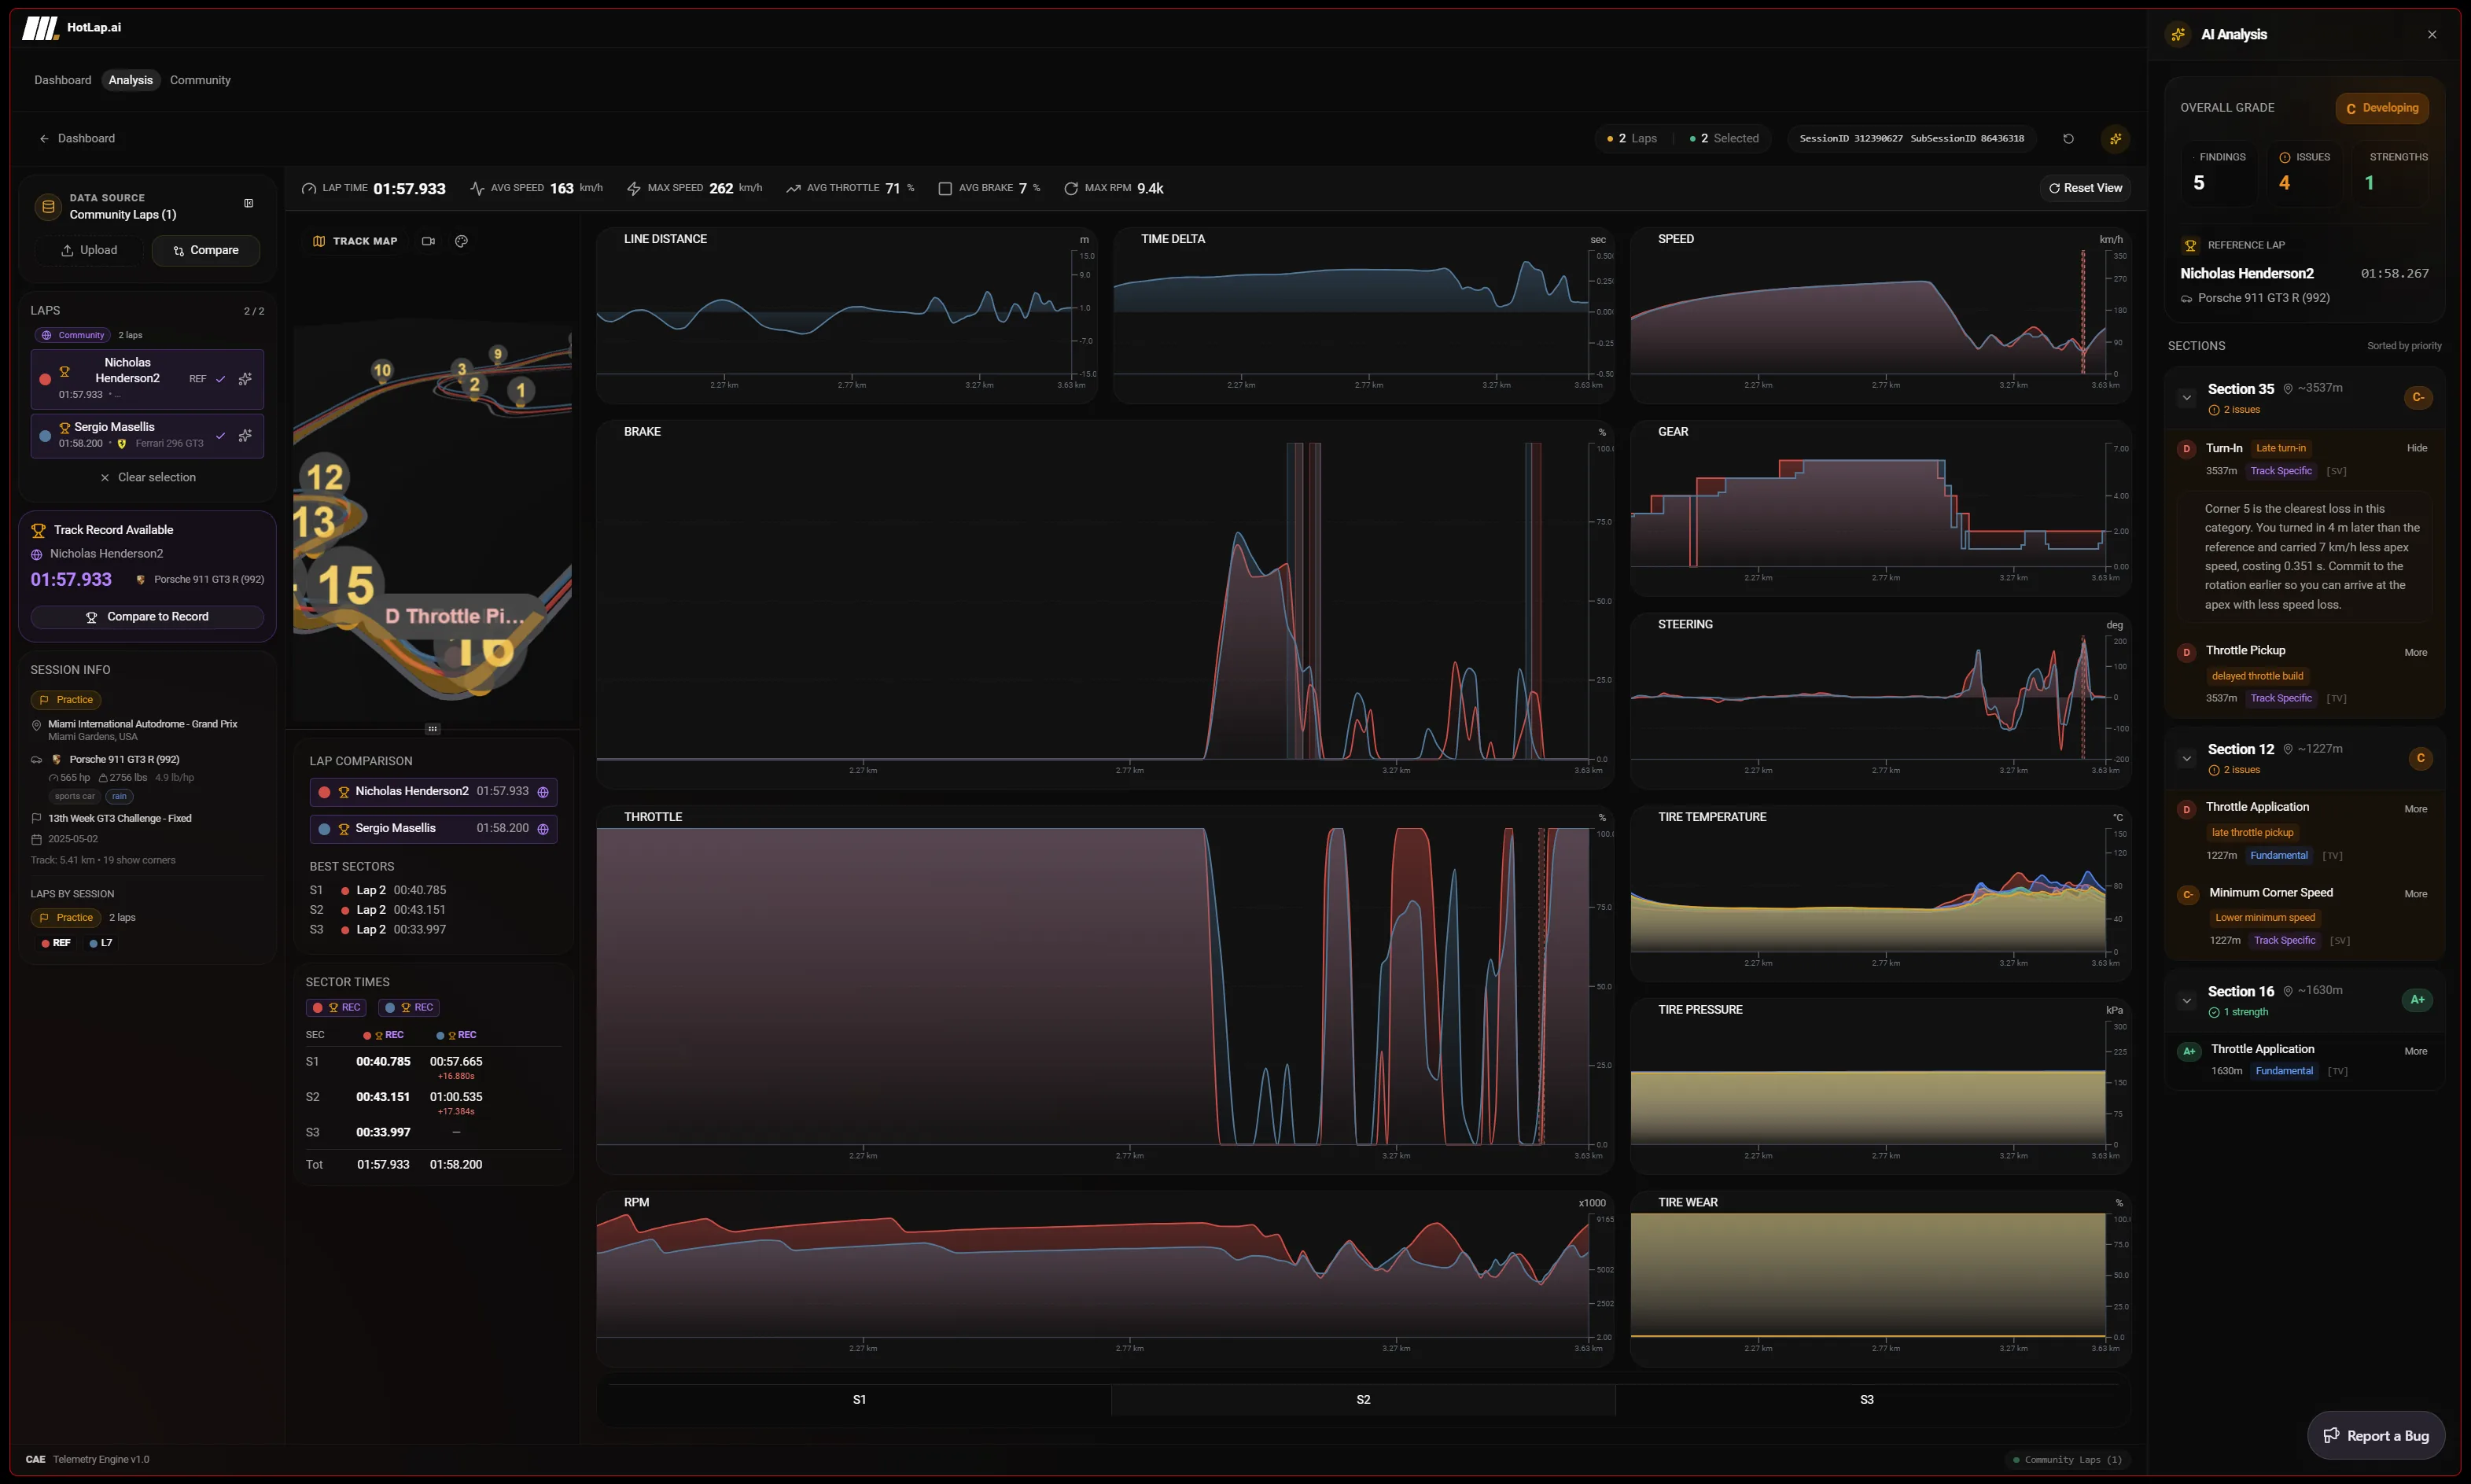
Distance alignment shows what both drivers did at the same point on the circuit. That makes brake points, apex speed, throttle pickup, and exit speed easier to compare than timestamp-only charts.
Yes. The analysis workspace supports local laps, cloud laps, community reference laps, and live lap data, with shared cursor, zoom, sector tables, lap stats, legends, and persistent chart layouts.
Use Hotlap.ai to compare the lap, understand the inputs, and leave review with one clear thing to try next.